
 , Michael J. Lambert
 Psychotherapy has been shown to be highly effective in reducing a variety of patient dysfunctions (Lambert & Ogles, 2004). Yet, efforts to improve care require examination of the limits of psychotherapy success, in particular, with cases that seem to worsen or drop out at higher levels of distress than when they began therapy. It is estimated that 5-10% of adult psychotherapy outcomes fit this worse case scenario (Lambert, Bergin & Collins, 1977; Mohr, 1995) and child and adolescent populations are likely similar (see Pekarik & Stephenson, 1988). Thus, in order to target such patients, clinicians need information on their patient’s therapy progress and how it might relate to their ultimate treatment response.
The monitoring of patient progress is certainly within the scope of routine clinical practice (Trijsburg, 2007). Clinicians, at least informally, monitor the progress of their patients in treatment. This may include ongoing assessment of observable behaviors, patient reports, and adjustment of treatment in regard to theoretical considerations and gathered data. Yet, the accuracy of therapeutic judgments regarding prognostic assessments even late in therapy has been questioned (Breslin, Sobell, Buchan & Cunningham, 1997; Meyer & Schulte, 2002). Similarly, clinicians are not always reliable in their judgments of patient progress and final outcome, especially with regards to predicting deterioration. Hannan et al. (2005), for example, found that therapists were inaccurate in predicting deterioration in a sample of 550 clients, predicting only one case out of 40 who eventually deteriorated.
Treatment response feedback research aims at providing information to clinicians about a particular patient’s progress in relation to final outcome. Technologies of this type are capable of alerting clinicians to potential treatment failures allowing for the opportunity of intervention. As such, they have enormous potential to impact the practice of psychology at the level of the patient. Similarly, such technologies have the potential to not only provide clinicians valuable treatment information, but they also allow for case management of outcomes by administrators and insurance providers (Johnson & Shaha, 1996).
An early warning system able to provide real-time feedback to clinicians regarding patient progress has also evolved based on work by Lambert and colleagues (Finch, Lambert & Schaalje, 2001; Lambert, Hansen & Finch, 2001). Their model has emphasized identification of ‘signal-alarm cases’, or those cases that are likely to deteriorate in therapy. Their approach was unique in that the information provided to the clinician was immediate and specific regarding what the patient had reported at recent sessions using a measure of outcome (Outcome Questionnaire-45). The goal was to provide therapists with feedback during the course of therapy, and to provide it soon enough that remediate action could be considered as soon as the client showed indicators of being in trouble.
In line with this goal, Finch et al. (2001) created empirically based recovery curves representing recovery across treatment based on the group mean. The curves provided a reference point for expected course of recovery by which individual patients could be contrasted. Additionally, tolerance bands were fit around the curves to provide designated cut offs for deviations from expectations (theoretically, this was set at a level likely to capture 10% of the population expected to deteriorate). In this manner, an empirical early warning system was developed. The research assessing its predictive validity at accurately identifying treatment failures was promising. For example, Lambert, Whipple, Bishop et al. (2002) reported hit rates of 100% at identifying patients who eventually deteriorated by final outcome. This technology is gaining validation for improving treatment outcomes through provision of this prognostic information to clinicians (Harmon et al., 2007; Hawkins, Lambert, Vermeersch, Slade & Tuttle, 2004; Lambert, Whipple, Smart et al., 2001; Lambert, Whipple, Vermeersch et al., 2002; Whipple et al., 2003); however, like the other technologies reviewed, it has largely been researched and implemented with adult populations.
In general, outcome research for child and adolescents lags behind that of accumulated data for adults (Durlak & McGlinchey, 1999; Kazdin, 2003). However, meta-analytic reviews support the conclusion that therapy for child and adolescent populations is beneficial (Kazdin, Bass, Ayers & Rodgers, 1990; Weisz, Weiss, Han, Granger & Morton, 1995). Psychotherapy treatment for child and adolescent populations is generally equal to adults in terms of effect sizes reported (Durlak & McGlinchey, 1999; Weisz, Weiss & Donenberg, 2002). To date there is sparse research on deterioration and on validating treatment response feedback technologies for child and adolescent populations (Bishop, Bybee, Lambert, Burlingame & Wells, 2005). Yet, the need for ongoing continuous assessment in the treatment of child and adolescent populations has been issued (Kazdin, 2001). The current study developed and attempted to validate an early warning system for use with child and adolescent populations.
This study relied on a large archival database of outcome scores of children and adolescents receiving psychotherapy. The database was large in that it included over 3,000 individuals (N = 3,712). The patients themselves received services through a large managed behavioral healthcare company, which insures over three million persons in 9 western states in both commercial and public sectors.
The sample included patients ages 4 to 18. The outcome measure used was filled out by the parent and included the same individual rater at each treatment session, with a majority of ratings made in settings that focus on children. Before filling out the measure parents consented to allow assessment and demographical information to be used in research provided their individual child’s identifying information (name and medical record number) were removed from the data base that was analyzed.
The database represents patients with a wide range of clinical disorders (mostly Axis I), but diagnostic information was missing in a significant number of cases. Past research with adults has indicated that, after the effects of initial level of disturbance are accounted for, little predictive ability can be attributed to diagnosis, especially when the diagnosis is generated in clinical practice (e.g., Brown & Lambert, 1998). Because the data were collected from on-going clinical practice, the data reflect the effects of patient progress during routine clinical interventions. Patients with only one treatment session were dropped from analysis, since no recovery curves could be generated from only one data point.
Information in the data base about the clinicians who provided treatment was limited in terms of amount of experience, training, and theoretical orientation. However, the therapists providing the care across settings were licensed professionals, mainly psychologists and social workers. Past research has consistently shown that therapist identified treatment orientation, years of experience, and professional education, are unrelated to treatment outcome (e.g., Lambert & Ogles, 2004; Wampold, 2001), making the absence of this identifying information in the current data set less problematic. Finch et al. (2001) did not find this seemingly important descriptive information important in the creation of expected recovery curves for adults as it failed to change the shape of expected recovery.
Youth Outcome Questionnaire-30 (YOQ-30)
Burlingame, Dunn et al. (2004) developed this thirty-item parent/self-report questionnaire to facilitate outcome management in 3-17 year olds. The YOQ-30 is a shortened version of the Youth Outcome Questionnaire (YOQ; Wells, Burlingame & Lambert, 1999). Both instruments attempt to measure clinically relevant domains such as intrapersonal distress, social problems, behavioral dysfunction, and interpersonal problems. In developing the YOQ-30 (Burlingame, Dunn et al., 2004) efforts were made to retain the high psychometric properties of the YOQ, which showed good reliability, validity, and sensitivity to change (Burlingame, Wells, Lambert & Cox, 2004). The thirty items composing the YOQ-30 were chosen from the YOQ based on their individual sensitivity to change as estimated from a large scale study of patients undergoing treatment in a variety of settings (Berrett, 1999).
The YOQ-30 is a self-administering tool given at the beginning of any therapy visit. It is intended for use in behavioral, medical health care and private practice settings to measure patient progress following treatment. The total score represents a summation of all 30 items and reflects the total behavioral and emotional distress in a child/adolescent’s life. It is meant to be used as a general index the clinician can use as a reference for functioning, relative to normative populations, as well as inform of patient progress in treatment. Although there are reliable differences in the way children of various ages (and males/females) are described or describe themselves on particular items, these differences average out when examining the total score. Thus normative data based on the total score do not require age and sex adjustments. Using formulas developed by Jacobson and Truax (1991) the YOQ-30 provides a reliable change index (RCI) for use in assessing patient change. Patients who change in a positive or negative direction by at least 10 points are regarded as having made reliable change, i.e., their change exceeds measurement error.
The YOQ-30 has demonstrated good psychometric properties. Internal consistency reliability estimates are reported at .96, as derived from normative samples (N > 3800). A moderately high correlation of .76 was found between the YOQ-30 and the Child Behavior Checklist (CBCL) (Achenbach, 1991), demonstrating adequate convergent validity. Sensitivity and specificity to distinguishing between clinical patients and ‘normal’ community samples has also been established (Burlingame, Dunn et al., 2004).
A transformation of the session number was performed in preparation for data analysis using a logarithm. This transformation was done so that the session number variable would more closely approximate a normal distribution, since session number in therapy studies is often negatively skewed.
Possible YOQ-30 scores range between zero and 120 points at intake. The intake score was used as the variable to initiate the recovery curve. This was considered the best choice of patient variables as change scores between intake and the first three sessions of therapy have been found to hold high predictive power for eventual final outcome in therapy (Haas, Hill, Lambert & Morrell, 2002).
The analyses used in the current study were designed to generate expected recovery curves using the YOQ-30 total scores and combine them with cutoff limits in order to identify patients who might fail at therapy. Though the entire range of possible YOQ-30 scores (0 – 120) would seem to provide a proper starting point for generating recovery curves, the current data set was not of sufficient size to model every single score. Given that scores falling at the extremes of the continuum are rare on the YOQ-30, the full range of scores was divided into distinct groups by percentiles. In other words, considering the range of intake scores (initial level of distress) on the YOQ-30, score bands were created which included an N of at least 150 at each scoreband. By doing so, a distribution across intake scores of relative normality could be achieved. Thus, intake score increments as small as one point at the group average were expected, while larger spreads between intake scores were expected at the extreme ends of the two tails. Using this rationale, the data set was divided into 19 score bands of relatively similar size. These score bands covered the entire range of possible YOQ-30 intake scores, allowing for the creation of recovery curves at each score band.
The data set was initially separated, randomly, into two groups (N1 = N2 = 1856). Both of these groups were used to model recovery curves. The first group derived the recovery curves, and the second group was used as a replication contrast for the stability of the curves. This step was completed to determine whether the methodology successfully reflected reliable recovery curves with predictable trajectories. A t test of significance between recovery curves pertaining to the same score band was then undertaken to examine the extent of differences between the two groups at the statistical level. Additionally, the resulting curves were compared for similarities.
After the creation of the score bands, the next step involved analyzing the data to develop recovery curves at each score band. The groups of data were analyzed using the PROC MIXED functions of the Statistical Analysis System (SAS) in order to generate a linear model for recovery curves. This form of analysis is typically referred to as Hierarchical Linear Modeling (HLM; Bryk & Raudenbush, 1992). HLM allows for modeling of multiple measurements across the same subject and provides substantial advantages over other statistical procedures by accounting for missing data for patients and the multiple sources of variance inasmuch as YOQ-30 scores are nested within patients, who may, in turn, be nested within therapists, nested within a specific treatment site, gender, and age. HLM identifies any statistically significant difference in error variance between random variables (e.g., between outcome scores at different sites), and, if found, the relevant amount of variance is identified and combined to create estimates and prediction intervals.
A random slope and a random intercept linear model for the YOQ-30 total score by session number was created (level 1), accounting for the within-subject variance of each patient and the between-subject variance. Mean estimates were then calculated for each session across the score-bands of intake scores (level 2). Error estimates from the fixed effects, random effects, and correlations were combined into an aggregate error term for the estimates of the YOQ-30 total score at each session. This combined error term was then used to establish the upper and lower bounds of prediction intervals for each of these coefficients.
Once the recovery curves were developed, analysis of their predictive validity was undertaken. This involved comparing individual scores on the YOQ-30 from session to session (up to session 20) with the recovery curves. If at any point a patient’s score fell outside the upper prediction intervals set around the curves, it was marked as a signal-alarm case, and was subsequently compared to its final outcome to judge the predictive validity of the early warning system.
The estimates resulting from the analysis of group data of half the sample were compared with the estimates of the second half to provide a replication contrast of the recovery curves. Such a step was considered important in providing confidence in the model as a reflection of recovery course, since it was assumed that general recovery from psychotherapy treatment across samples of children and adolescents would be similar. A t test of significance comparing the recovery curves at each of the 19 scorebands found 3 of the curves to have differences noticeable at the statistical level (p= .05). At the statistical level, the lack of significant differences between the sixteen scorebands does not affirm by inference that no differences exist. Nonetheless, only three of the nineteen slopes showed a difference at the statistical level. A visual inspection of the slopes of all of the recovery curves, as well as a comparison of their estimates, did show a general trend and comparability. This phenomenon was observable, too, when looking at the 3 recovery curves noted for statistical differences. One of these 3 had its scoreband in the normal range of distress, reflective of community populations, rather than levels of distress typical of outpatients. All 3, like the rest of the scorebands, showed negligible differences between estimates (e.g., often 3-6 points), and therefore not deemed to have much practical impact. In other words, the variance between slopes in the 3 cases, though statistically different, is minimal enough in YOQ-30 scores session to session to avoid severely compromising the overall integrity of normative comparisons with a particular patient in treatment.
Overall, the 16 statistically similar slopes, and the visual trend and comparability amongst all of them, support the notion that the slopes are accessing general recovery. In terms of the overall picture, the model under evaluation is adequate in its stability and thereby a good estimate of the type of stability expected for general treatment course recovery amongst children and adolescents.
Based on the model initiated by Finch et al. (2001), prediction intervals were calculated for the expected mean YOQ-30 total score at each session. Prediction intervals determine the probability that a given score at a given session will fall within a specified interval. A two-tailed, eighty percent prediction interval was first created for each of the coefficient estimates. This provided a cutoff score at each session, which can be useful for identifying patients that might be on a trajectory towards treatment failure. Next, a two-tailed, sixty-eight percent prediction interval was calculated. This second prediction interval provided cutoffs for those patients a standard deviation above or below the expected recovery rate.
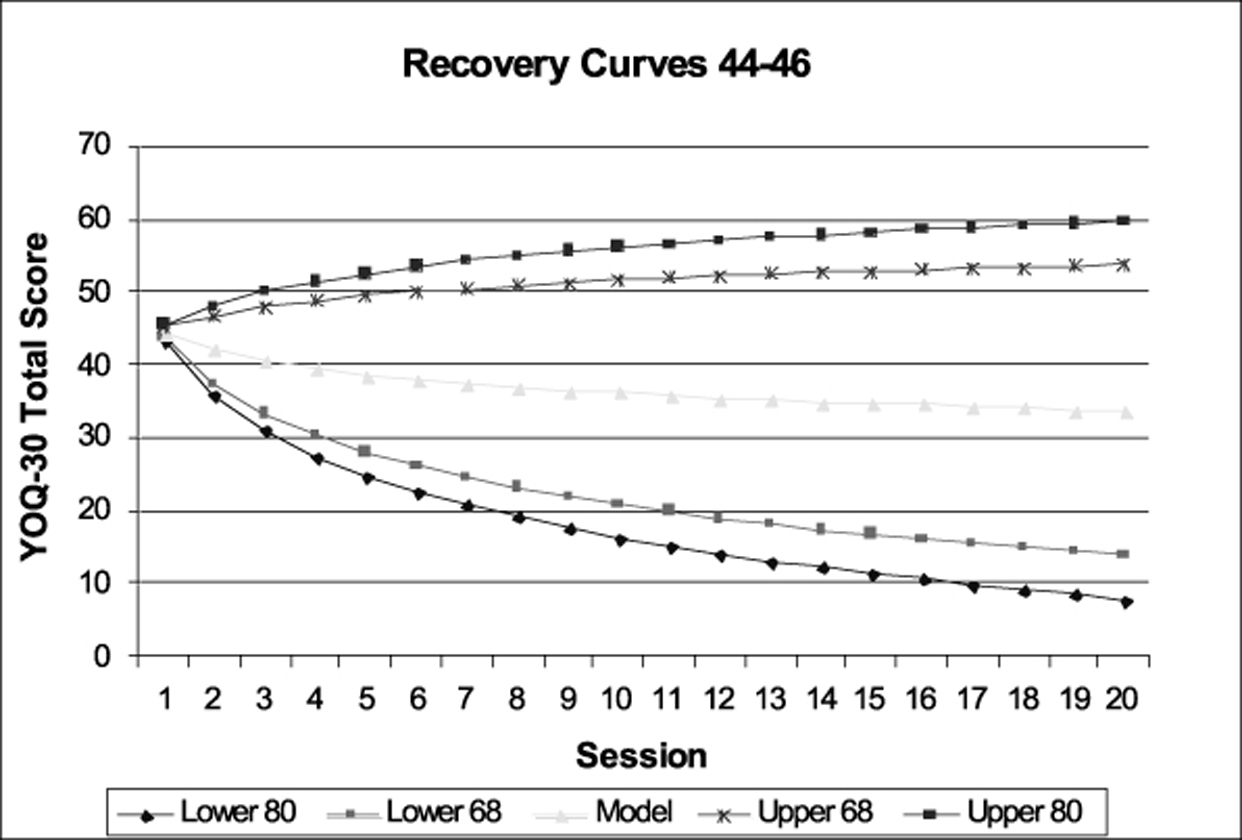
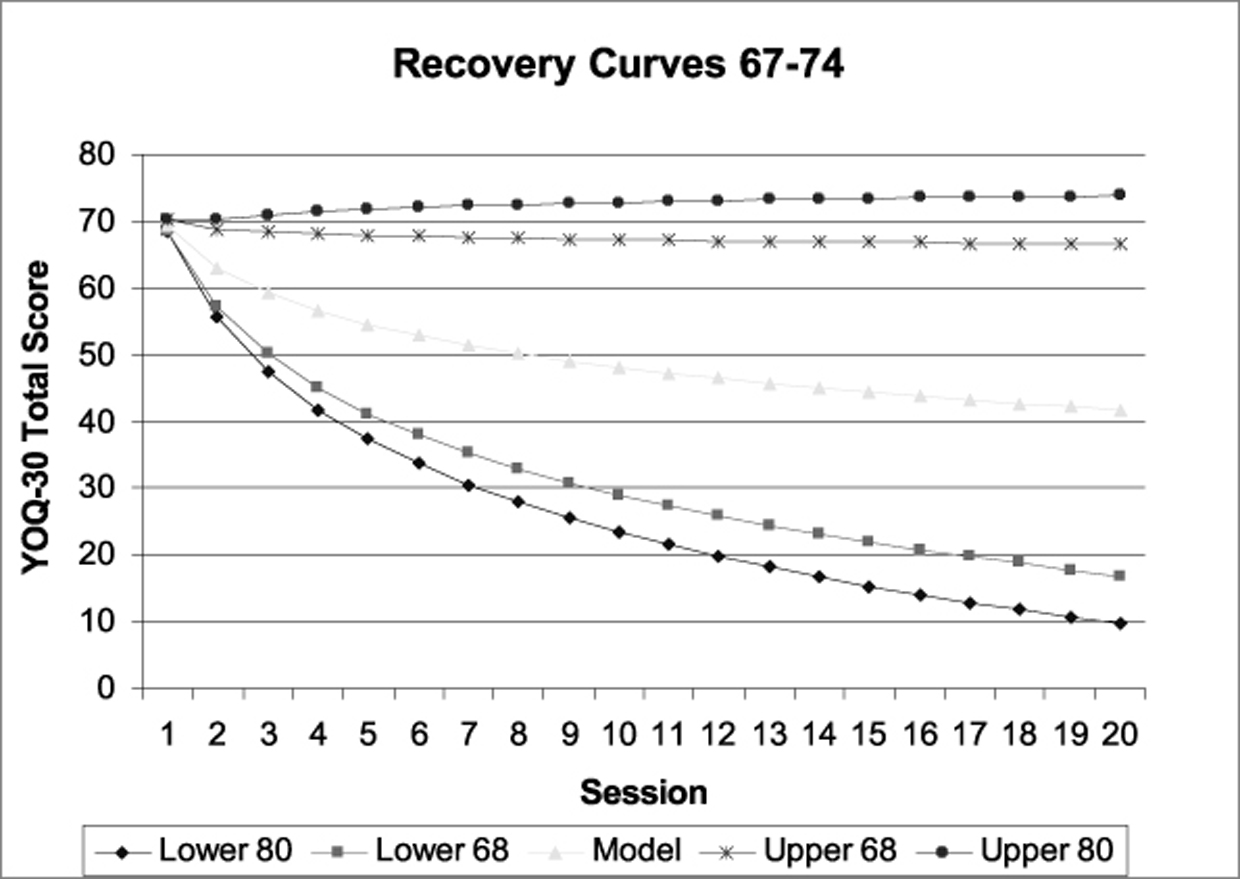
Together, the coefficients and prediction intervals form what Lambert et al. (2001) call an ‘empirically derived warning system’. Charts can be provided, which display predicted therapeutic gains against which any patient can be compared. For example, on intake, a patient’s completed YOQ-30 total score can be compared to the values obtained for others beginning therapy with similar scores. As the patient moves along in therapy, if their total YOQ-30 score were to fall within both the eighty percent and the sixty-eight percent prediction intervals shown on the chart, then the patient would be considered on track and proceeding in therapy as would be expected. Whereas, if the patient’s total score falls outside the sixty-eight percent prediction interval, but was still within the eighty percent prediction interval, then the patient is beginning to deviate by greater than one standard deviation from what is expected of a typical person at this point in therapy. In such a case, research with adult clients indicates that the therapist would want to attend more carefully to the patient’s progress, but not necessarily change anything. However, if a patient’s total score falls outside both prediction intervals, then the patient is deviating significantly from what is typically expected at that point in therapy and is considered a signal-alarm case. Given that the eighty percent prediction interval is set to capture the upper 10% of patients falling outside the expected range of scores for that session, the particular patient’s recovery is thereby offset from what is expected. The 10% boundary is consistent with adult estimates elsewhere asserting that up to 10% of patients deteriorate following psychotherapy (Lambert & Ogles, 2004). Thus, at this point a therapist might consider an alternative course of action and a reevaluation of treatment interventions as the patient may be heading toward an unsuccessful outcome.
The 3,712 patients in the sample were divided into two groups: those falling into the warning zone – labeled as a ‘signal-alarm case’ – at any point during therapy (i.e., moving out of the 80% prediction intervals, in the direction of greater distress) and those patients who never moved into the warning zone (i.e., ‘on-track’ cases). Each case was then assigned into one of the following categories according to treatment outcome assessed by the YOQ-30: a) improved, b) no change, c) deteriorated.
These categories were based on estimates of reliable change, as defined by formulas set forth by Jacobson and Truax (1991). For a patient to be considered improved, they must have had a reliable change in the direction of less distress as measured by their YOQ-30 scores (comparing beginning and final scores for a patient’s treatment). Whereas, for a patient to be considered deteriorated, they must have had a reliable change in the direction of more distress by the end of treatment based on their initial and final YOQ-30 scores. A patient whose initial and final YOQ-30 scores achieved no reliable change in either direction was categorized as no change.
|
Predicted negative outcome (Signal-alarm case) |
Predicted positive outcome (On-track case) |
Total N |
|
|---|---|---|---|
|
Treatment failures |
307 (8.3%) |
122 (3.3%) |
429 (12%) |
|
Patients who did not fail in treatment |
317 (8.5%) |
2966 (79.9%) |
3283 (88%) |
|
Total N |
624 (17%) |
3088 (83%) |
3712 |
|
Sensitivity rate |
72% |
||
|
Specificity rate |
90% |
||
|
Hit rate |
88% |
||
|
Positive predictive power |
49% |
||
|
Negative predictive power |
96% |
This study established an easily utilized process for tracking patient progress and identifying potential treatment failures early on in therapy. An early warning system such as this one has the potential to improve case management by allowing clinicians to be alerted to signal cases, while, theoretically, normally progressing patients need not utilize unnecessary time and resources.
The early warning system consisted of empirically generated recovery curve bands (across the range of YOQ-30 intake scores) with prediction intervals set around these curves for detection of deviation from recovery. The curves were thought to reflect a general course of recovery for child and adolescent patients, since negligible differences between the model and a replication contrast model were observed and similarities between estimates on a practical level were observed. The two sets of prediction intervals, representative of departure from recovery curve scores predicted for 10% (80% intervals) or 16% (68% intervals) of the sample. The 68% prediction interval, inasmuch as it would be more likely to over-identify signals, can be seen as more of a caution or ‘yellow’ signal, since there would be less confidence in accuracy. The 80% prediction interval can be seen as a ‘red’ signal, since there would be more confidence of accuracy. Together with the recovery curves, they function as a system of detection. Scores falling on or outside prediction intervals were classified as ‘signal alarms’ predicted to deteriorate in final outcome.
Analysis of the early warning system found that the method was reasonably accurate. This system identified 72% of all cases that eventually had a negative outcome. This level of precision far exceeds the base rate of deterioration for this sample (12%). Given that clinicians are poor at predicting treatment failure (Hannan et al., 2005), the results are viewed as promising, especially since the purpose of an early warning system is to detect potential treatment failure (rather than outcome more generally). Such a finding holds promise for use amongst child and adolescent populations for early identification of potential treatment failures.
While the current study identified 72% of treatment failures using the 80% prediction intervals, it identified 85% of treatment failures using the 68% intervals. However, this was at the expense of nearly doubling the number of false signals. Thus, the ‘red’ signals were much more likely to be deteriorated. Adjusting prediction intervals in order to identify more deteriorators thus resulted in more false-positive signals, diluting the meaning of a signal. Decreasing false-alarm rate is a future concern for the refinement of the current system. Yet, it should be appreciated that past research has revealed a tendency for false-positive signal cases to nonetheless have less than favorable outcomes (Lambert, Whipple, Bishop et al., 2002). This suggests the likely value of paying attention to both red and yellow signals.
The sample of patients used here received their services in a variety of settings across 9 western states. The types of outpatient treatment reflected a variety of differences in approach to care, thus the expected recovery curves developed here are quite general. Differences between patients seeking care under different outpatient and inpatient settings may limit the application of the current system in unknown ways. Increasing the number of different settings as well as the size of the data set could improve accuracy of the estimates for the recovery curves. Additionally, a larger data set would allow for more specific recovery curves as they relate to more specific intake scores of the YOQ-30. The lack of patient-specific and treatment-specific variables as they may affect treatment trajectory, also were likely to have reduced predictive accuracy. Howard, Lueger, Maling & Martinovich (1993) have argued that different types of symptoms (e.g., morale, symptoms, character) change at different rates in psychotherapy.
A similar argument that different diagnoses may have different paths towards improvement in treatment can be made. The current data set, though it contained patients with a wide variety of diagnoses, did not lend itself to the derivation of, for example, diagnosis-specific recovery curves. Though such may be a consideration for future research, it should also be considered that some research has shown diagnosis contributing little to predictions of speed of recovery once the level of initial distress is taken into account (Brown & Lambert, 1998). The current research is a good test case to that effect: the recovery curves developed were diagnosis nonspecific but still identified 72% of deteriorated cases. Nonetheless, in particular with child and adolescent populations, the effect on trajectory that diagnosis or other patient-specific variables may have is worth considering should it improve these identification rates. Yet, practical constraints must also be considered. It is much easier to give a five-minute test, which assesses a patient’s level of distress than to conduct a diagnostic interview, which ultimately has limited reliability. Thus, while this system may be limited by its reliance on level of distress as a predictor of treatment outcome, it uses the best predictor known and is practical for regular practice settings.
| 1. |
The initial YOQ-30 score of the patient (their score at intake);
|
| 2. |
The current YOQ-30 score of the patient for the current session.
|
Using the graphs, which are a visual depiction of the recovery curves and their prediction intervals plotted across 20 sessions, clinicians can easily reference their particular patient’s level of progress with expected progress and in relation to the prediction intervals signaling treatment failure. The ease of such a system lends itself well to clinical practice where the time and effort involved to utilize the system is minimal. Similarly, software (OQ-Analyst) has been developed that permits automated scoring, algorithm application, progress graphs, and alerts for predicted negative outcome, reducing time demands on busy clinicians.
More important is the type of information offered by the system itself. What would clinicians do if information was available to them indicating that a specific therapy patient was projected to deteriorate? Suppose on intake a particular patient scores 56 in the clinical range on the YOQ-30 – an indication of significant distress resembling those treated in outpatient therapy. Over the next 4 sessions, suppose scores decline until on the 5th session when the score jumps up to 63. At this point, the system would indicate potential treatment failure, a ‘signal alarm’. The clinician has a number of ways in which this information may be addressed, such as pursuing further assessment through the use of other measures related to the patient’s treatment goals and diagnosis, or investigating situational factors occurring in the life of the patient. Similarly, the clinician may assess the fit of the modality of treatment with the specific patient, or an exploration of the effect of interventions from the previous session may be assessed.
The effects of utilizing signal alarm feedback have already begun to be measured. Cases identified as signals were found by Lambert et al. (2001) to have improved outcomes and more sessions when so identified to therapists (as contrasted with controls were such cases were not known to therapists). Outcome comparisons between the signal cases in the feedback condition and the treatment-as-usual control revealed moderate effect sizes of approximately .40. Additionally, a smaller percentage of deteriorators were among the patients of therapists receiving feedback (13.4% versus 21.3% in treatment as usual; Lambert et al., 2003).
Hawkins et al. (2004) examined the effects of providing feedback on course of recovery to the patients themselves. Patients did appear to benefit from the provision of feedback and frequently reported interest in receiving such feedback (e.g., on a scale of 1-9, with 9 being very interested in feedback, a median rating of 8 was reported). It is hoped that with the arrival of this methodology to the child and adolescent populations clinicians can begin to benefit from receiving feedback on their patients progress as they have with adult populations and that research trends in the development of feedback provision may continue using the YOQ-30. A provocative area of exploration in child and adolescent populations may be on the effects of providing feedback on patient progress to the parents of such patients.
This study followed the methodology used in deriving recovery curves for adult populations. In doing so, this represents an initial first step towards improving the continuous monitoring of quality care through treatment response feedback in child and adolescent populations. Future research can improve upon this line of research by refining the parameters used to derive recovery curves. For instance, recovery curves appropriate to more refined age groups is likely to improve upon the predictive accuracy as well as be more relevant to the child and adolescent populations. Also of potential importance are differences between adolescent self-report and parental reports, which were not taken into consideration while generating recovery curves. Future research is needed to understand if separate parent and self-report curves are needed because self-reports of child disturbance are systematically lower compared to parent reports. Similarly, research examining the characteristics of deteriorators at the child and adolescent level may identify important categories for use in a predictive model as well as relate to interventions to reduce their at-risk status.
The type of patients used to create the recovery curves used in this study included not only patients who reliably improved but also those who did not change, and those who deteriorated. As such, the curves themselves reflect a general course of recovery. Modeling curves based on only the subgroup of reliably recovered patients may better reflect a benchmark for comparative patient progress. Additionally, it may have the potential at improving prediction of deteriorators or those who may drop out early from treatment. Because of the high number of non-changing patients often found in outcome samples from routine care, such a model may risk increasing false-positive signals as the non-changers depart from such recovery curves. However, such a line of research does hold promise for attempting to deal with non-changers as a subgroup itself – something not typically examined in outcome research, nor typically dealt with in a systematic way by clinicians monitoring care.
The amount of deteriorators that escaped signal alarm identification deserves attention. Though the accurate identification rate of 72% of deteriorators is impressive, future lines of research should aim at improving this rate and assuring that potential deteriorators do not go undetected. For the individual patient, failure to be identified may mean a loss in invested resources of time and money. A social cost to others in the community is likely, especially as the quality of deterioration for the patient begins to impact social, academic, and occupational domains. Future research may examine the nature of deteriorators who go undetected along the course of therapy in hopes of better refining the means of identification.
The number of false positive signals was low relative to the amount of patients who actually improved or demonstrated no change (12% to 9% respectively). It would be interesting to investigate the impact these false-positive signals have on the final outcome of such patients. Previous research by Lambert, Whipple, Bishop et al. (2002) suggested that since many false-positives nonetheless did not achieve reliable recovery on final outcome, such cases were in need of clinical attention anyway.
It is equally important to consider the cost in a clinical context of a false signal-alarm. While in medical practice the potential cost of false-positive information indicating operative surgery may be enormous aside from only financial impact, in clinical practice such concerns do not typically exist. Similarly, the value of an alert to a clinician at the least increases attention for the case, but need not mandate any specific changes to ongoing treatment. Lambert, Whipple, Bishop et al. (2002) suggested that the current level of misidentification seems tolerable since the warning system alerts therapists to the possible need for action rather than triggering a negative event, such as psychosurgery, ECT, and the like. Regardless, therapists need to be aware of the degree to which false alarms exist so that they can adjust their decision making with this information in mind.
A gathering body of research indicates that providing treatment response feedback to clinicians has a positive impact on the course of therapy (Harmon et al., 2007; Hawkins et al., 2004; Lambert et al., 2001; Lambert, Whipple, Vermeersch et al., 2002; Whipple et al., 2003;). It was with such research in mind that the development of recovery curves for use with the children was undertaken. The identification of the most useful and accurate means of providing feedback as well as the identification of interventions aimed at reducing deterioration and improving final outcome remains to be investigated. Nonetheless, this research and its potential future hold promise of practical utility to patients.